Unlocking the Power of BigQuery: Your Ultimate Guide to Using Looker Studio and Reporting Tool
07th Feb 2024
5 Minutes Read
By Atharva Tandale

Obtaining data from the user interface of Google Analytics 4 (GA4) according to your specific requirements can be quite challenging and sometimes even impossible. However, by utilizing dashboard BI tools, we can create customized dashboards using BigQuery as a data source.
Have you ever considered incorporating BigQuery as a data source for your dashboard?
If not, in this blog post, I will provide you with a comprehensive guide on utilizing BigQuery as a reporting tool for any dashboard tool you use, whether it's Looker Studio, Power BI, Tableau, or others.
How to use BigQuery as a BI and Reporting Tool?
In the age of immense data, businesses face the challenge of effectively extracting valuable insights from vast amounts of information. Addressing this challenge requires organizations to adopt a resilient Business Intelligence (BI) and reporting tool. Presenting BigQuery, a cloud-based data warehouse and analytics platform developed and supported by Google Cloud Platform. With its
scalable infrastructure and advanced querying capabilities, BigQuery has emerged as a top choice for enterprises seeking a powerful BI and reporting tool. In this blog post, we will see how to exploit the full potential of BigQuery to meet your analysis needs.
In order to develop a dashboard for GA4 data, it is essential to establish a seamless integration between the recently introduced Google Analytics 4 (GA4) property and BigQuery. This integration enables the creation of a data source specifically tailored to the dashboard's requirements.
GA4 Overview:
The GA4 dataset is primarily organized with a strong emphasis on event and user data, augmented by additional information such as device, geographical, app, and traffic source data. Unlike the Universal Analytics Schema, where each row represents a single session, GA4 properties are event-based, meaning that each row in our dataset corresponds to an event. Moreover, within each event, there can be multiple event parameters and their respective values.
Here I have queried a GA4 dataset to show you the schema :
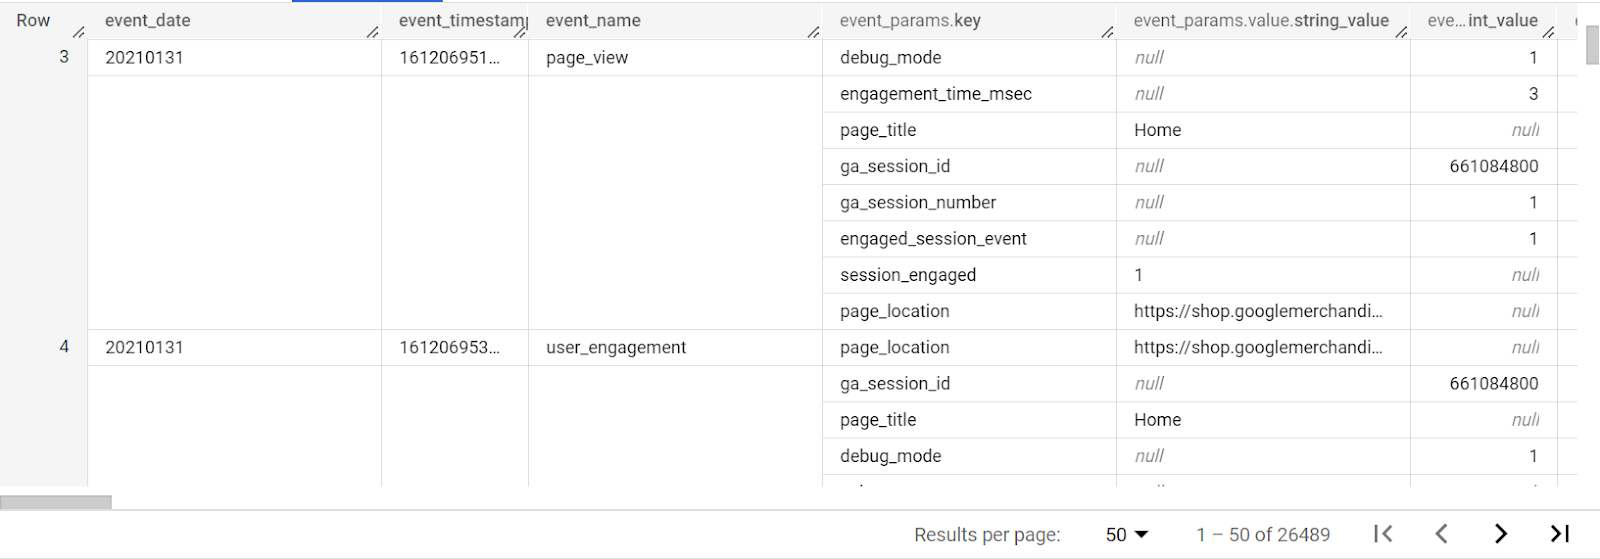
As you can see in the above example data is in a nested format. To set up a data source for a dashboard we need to query this nested data as per the requirement of the dashboard by creating a table which has the required dimensions and metrics. While creating the data source for the dashboard in some scenarios depending on the requisite we need to unnest the following data carefully such that none of the data is duplicated.
NOTE: Sharing the GA4 schema to gain a comprehensive understanding of the data.
- Foundation of BigQuery Data Source:
Before delving into its BI capabilities, it is essential to understand the fundamental principles of BigQuery. It is a serverless, fully-managed data warehouse designed for processing and analyzing massive datasets using SQL-like queries. Its architecture facilitates high concurrency and real-time data analysis, making it an optimal choice for BI and reporting purposes.
Planning is important for creating Data sources for any dashboard. We’ll need to check whether we want to see real-time data or if the data is to be updated at a certain frequency such as days, weeks, etc.
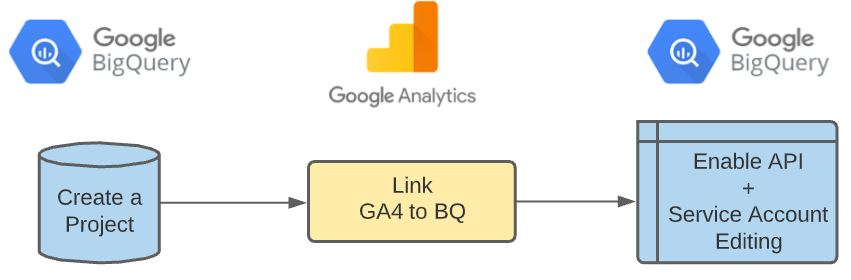
- Data Integration (Link GA4 property to BigQuery):
Before enabling the integration initially the first step is, to begin with the set-up of a GA4 property.
However, it's essential to meet a prerequisite, which involves having edit-level access to the relevant Google Analytics account where you intend to create the GA4 property.
Under the option of ‘PRODUCT LINKS’, you will find an option for ‘BigQuery Links’
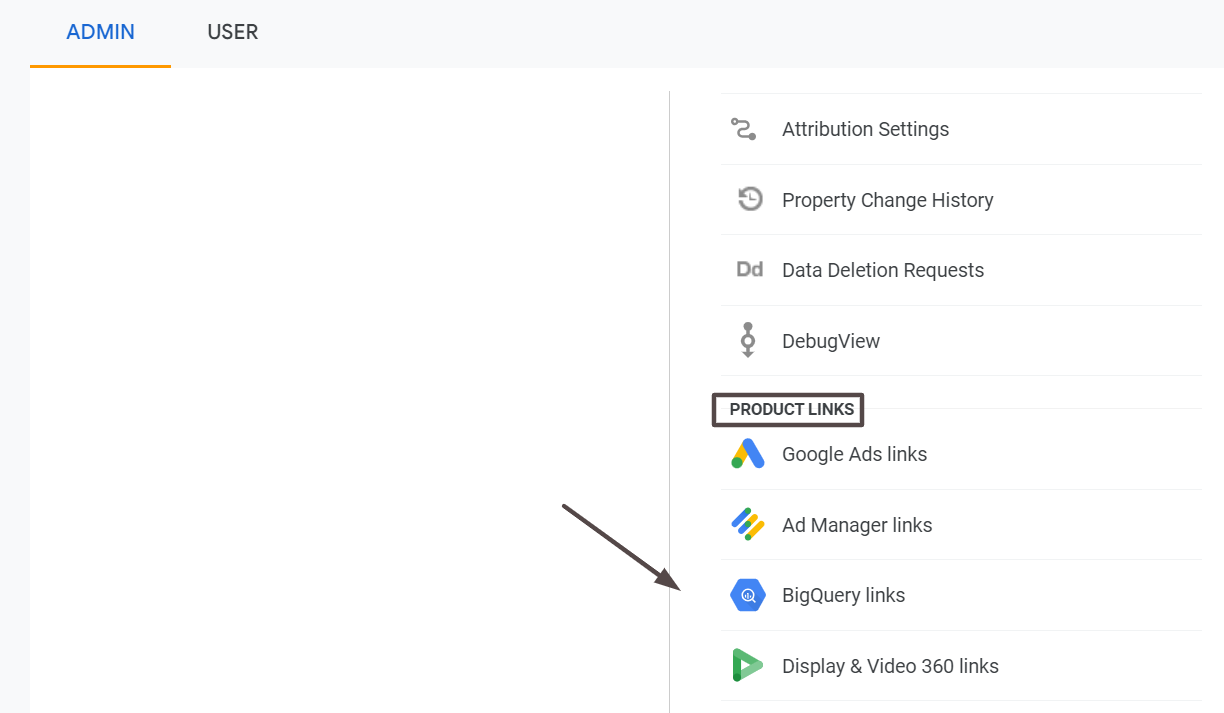
After selecting the option we will need to follow a few steps as per the requirement to complete setting up the BigQuery linking process.
We will require until the next morning (some people may need to wait a bit longer), then go to your BigQuery project. You will now see your raw Google Analytics data from Google Analytics 4 being populated in a similar way.

- Strategizing Efficient Queries
One of BigQuery's main strengths lies in its ability to execute complex queries at incredible speed. However, to fully optimize the platform's performance, it is crucial to write efficient queries. Employing partitioned tables, clustered columns, and denormalization techniques can significantly enhance query execution. Avoid using SELECT * and instead, specify only the necessary columns to reduce data processing overhead.
One of the major advantages of using BigQuery to use as a data Source is that you can mould the query as per your needs.
I have an instance here, where I am selecting the required metrics and dimensions for the dashboard in order to create a dashboard in Looker Studio:
Dimension | Metrics |
event_date | item_viewed |
event_name | item_purchased |
item_id | item_revenue_in_usd |
item_category | |
item_brand | |
channel_grouping_user |
Here we have the list of few dimensions and metrics we need in looker studio as a data source.
- Data Source Modelling:
While BigQuery provides its query editor for manual analysis, integrating BI and reporting tools into the workflow can greatly enhance productivity. Tools such as Google Data Studio, Looker, and Tableau seamlessly connect with BigQuery, allowing you to create interactive dashboards, reports, and visually compelling data representations with ease.
We’ll now write a SQL-query in BigQuery by taking into account the list of dimensions and metrics we need in this case, we will need to unnest the data
with items as in GA4 schema, we receive the data in a nested form
QUERY: (traffic_source.medium in ('(not set)','(none)')) then 'Direct' then 'Cross-network' shopping|shopify|etsy|ebay|stripe|walmart') '^(.*(([^a-df-z]|^)shop|shopping).*)$')) '^(.*cp.*|ppc|paid.*)$') then 'Paid Shopping' google|yahoo|yandex') 'Paid Search' linkedin|pinterest|tiktok|twitter|whatsapp') 'Paid Social' netflix|youtube|vimeo|twitch|vimeo|youtube') 'Paid Video' 'expandable', 'interstitial', 'cpm') then 'Display' shopping|shopify|etsy|ebay|stripe|walmart') '^(.*(([^a-df-z]|^)shop|shopping).*)$') then 'Organic Shopping' linkedin|pinterest|tiktok|twitter|whatsapp') network','social media') then 'Organic Social' netflix|youtube|vimeo|twitch|vimeo|youtube') then 'Organic Video' ecosia|google|yahoo|yandex') Search' 'Mobile Push Notifications' AS Item_Viewed, Item_Purchased, |
NOTE: Please update the table name as per your need if you use the above query.
In the query given above you will find we have some custom dimensions and metrics that are to be calculated/shown in the dashboard such as channel_grouping_user, item_viewed, and item_purchased. These dimensions and metrics are not readily available in the GA4 data.
RESULTS:
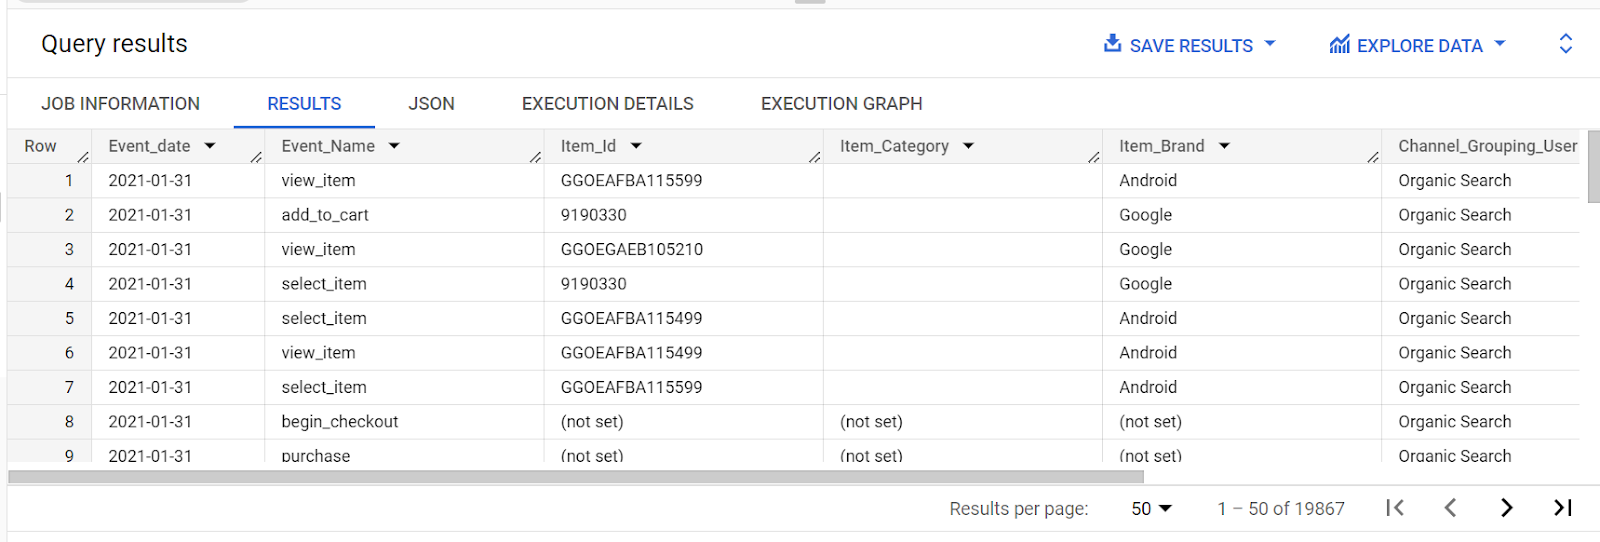
You will find the query results in a similar way.
NOTE: Above query is written with the help of ga4bigquery and depending on different scenarios the unnesting of the data will be required i.e. there would be cases where unnesting of the data won’t be required.
- Real-time Analysis with Streaming Data:
For businesses relying on real-time insights, BigQuery offers a streaming data feature. By streaming data directly into the platform, you can analyze events as they occur, empowering timely decision-making and providing a competitive advantage in dynamic markets.
In this example, I will show you how to schedule the query we have on a daily basis so the data source is always updated.
NOTE: Before scheduling the query we need to make a data source table of the ‘query results’ we have received such that when we schedule the query it has a data source table to append/overwrite the data in the table.
For this instance let's assume I have a table called ‘Table_1’ which I have created as a data source.
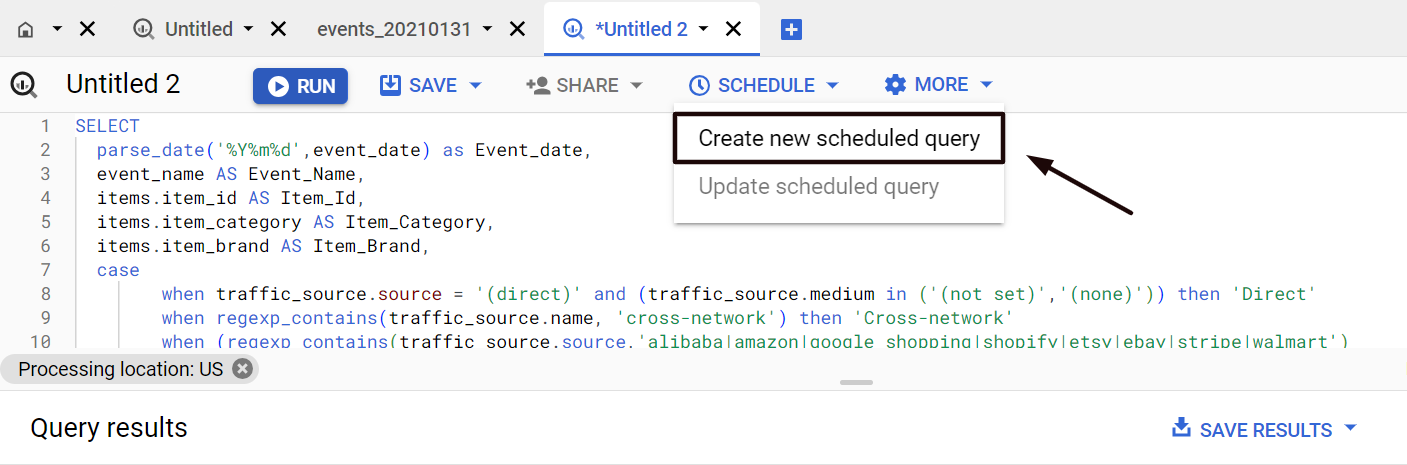
You will have an option in the centre of the query section called ‘Create new scheduled query’
After selecting the option you will first need to fill in the essential details such as the name of the scheduled query, start time, etc.
NOTE: Please keep in mind if you need to schedule the query on a daily basis please set the ‘repeated frequency’ - Days
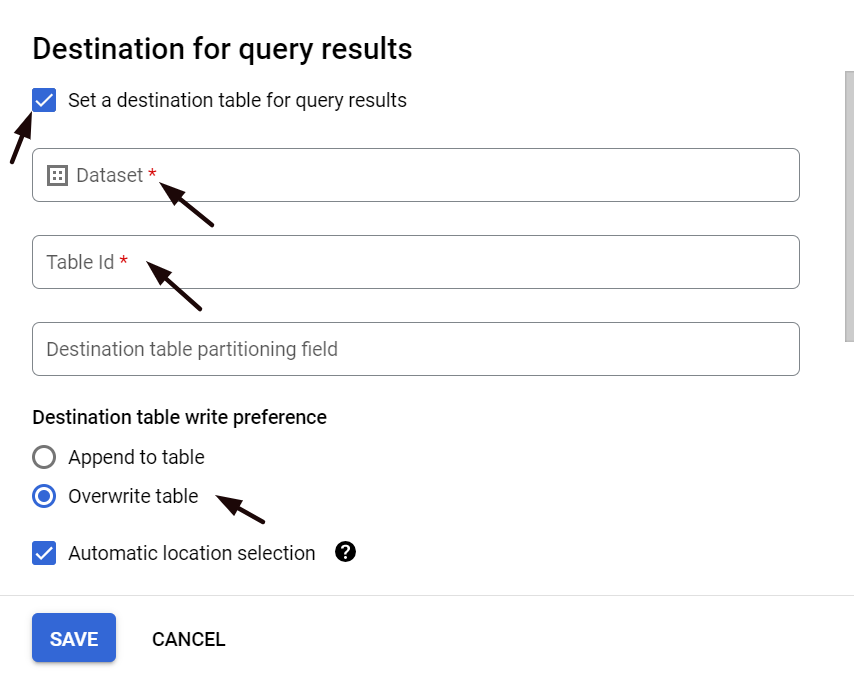
The most important thing while scheduling the query is to set the destination table and table write preference
First, select the option ‘Set a destination table for query results’ and then write the database name in which you have the data source table and in this scenario, our table name would be ‘Table_1’
Select the option ‘overwrite table’ so the table is completely refreshed.
NOTE: If you are selecting the option ‘overwrite table’ make sure the query should be on the complete table rather than on a single date.
For example, the table name should be similar to this -
`bigquery-public-data.ga4_obfuscated_sample_ecommerce.events_*`
Once you ‘SAVE’ the scheduled query successfully so check ‘scheduled queries’ to find the progress of your query.
Summary:
In conclusion, integrating BigQuery as a reporting tool with dashboard BI solutions like Looker Studio offers businesses a powerful means of unlocking valuable insights from Google Analytics 4 (GA4) data. While obtaining data directly from the GA4 user interface can be challenging, leveraging BigQuery as a data source allows for the creation of customized dashboards tailored to specific requirements.
Data source modeling, coupled with BI and reporting tools, enhances productivity by enabling the creation of interactive dashboards and visually compelling data representations. The ability to schedule queries ensures that data sources remain up-to-date, enabling accurate and relevant insights for decision-making.
In conclusion, BigQuery coupled with the right BI and reporting tools offers a robust solution for businesses seeking to unlock the power of their data and drive success in a data-driven world.

